SP500 LDN TRADING UPDATE 20/3/26

SP500 LDN TRADING UPDATE 20/3/26
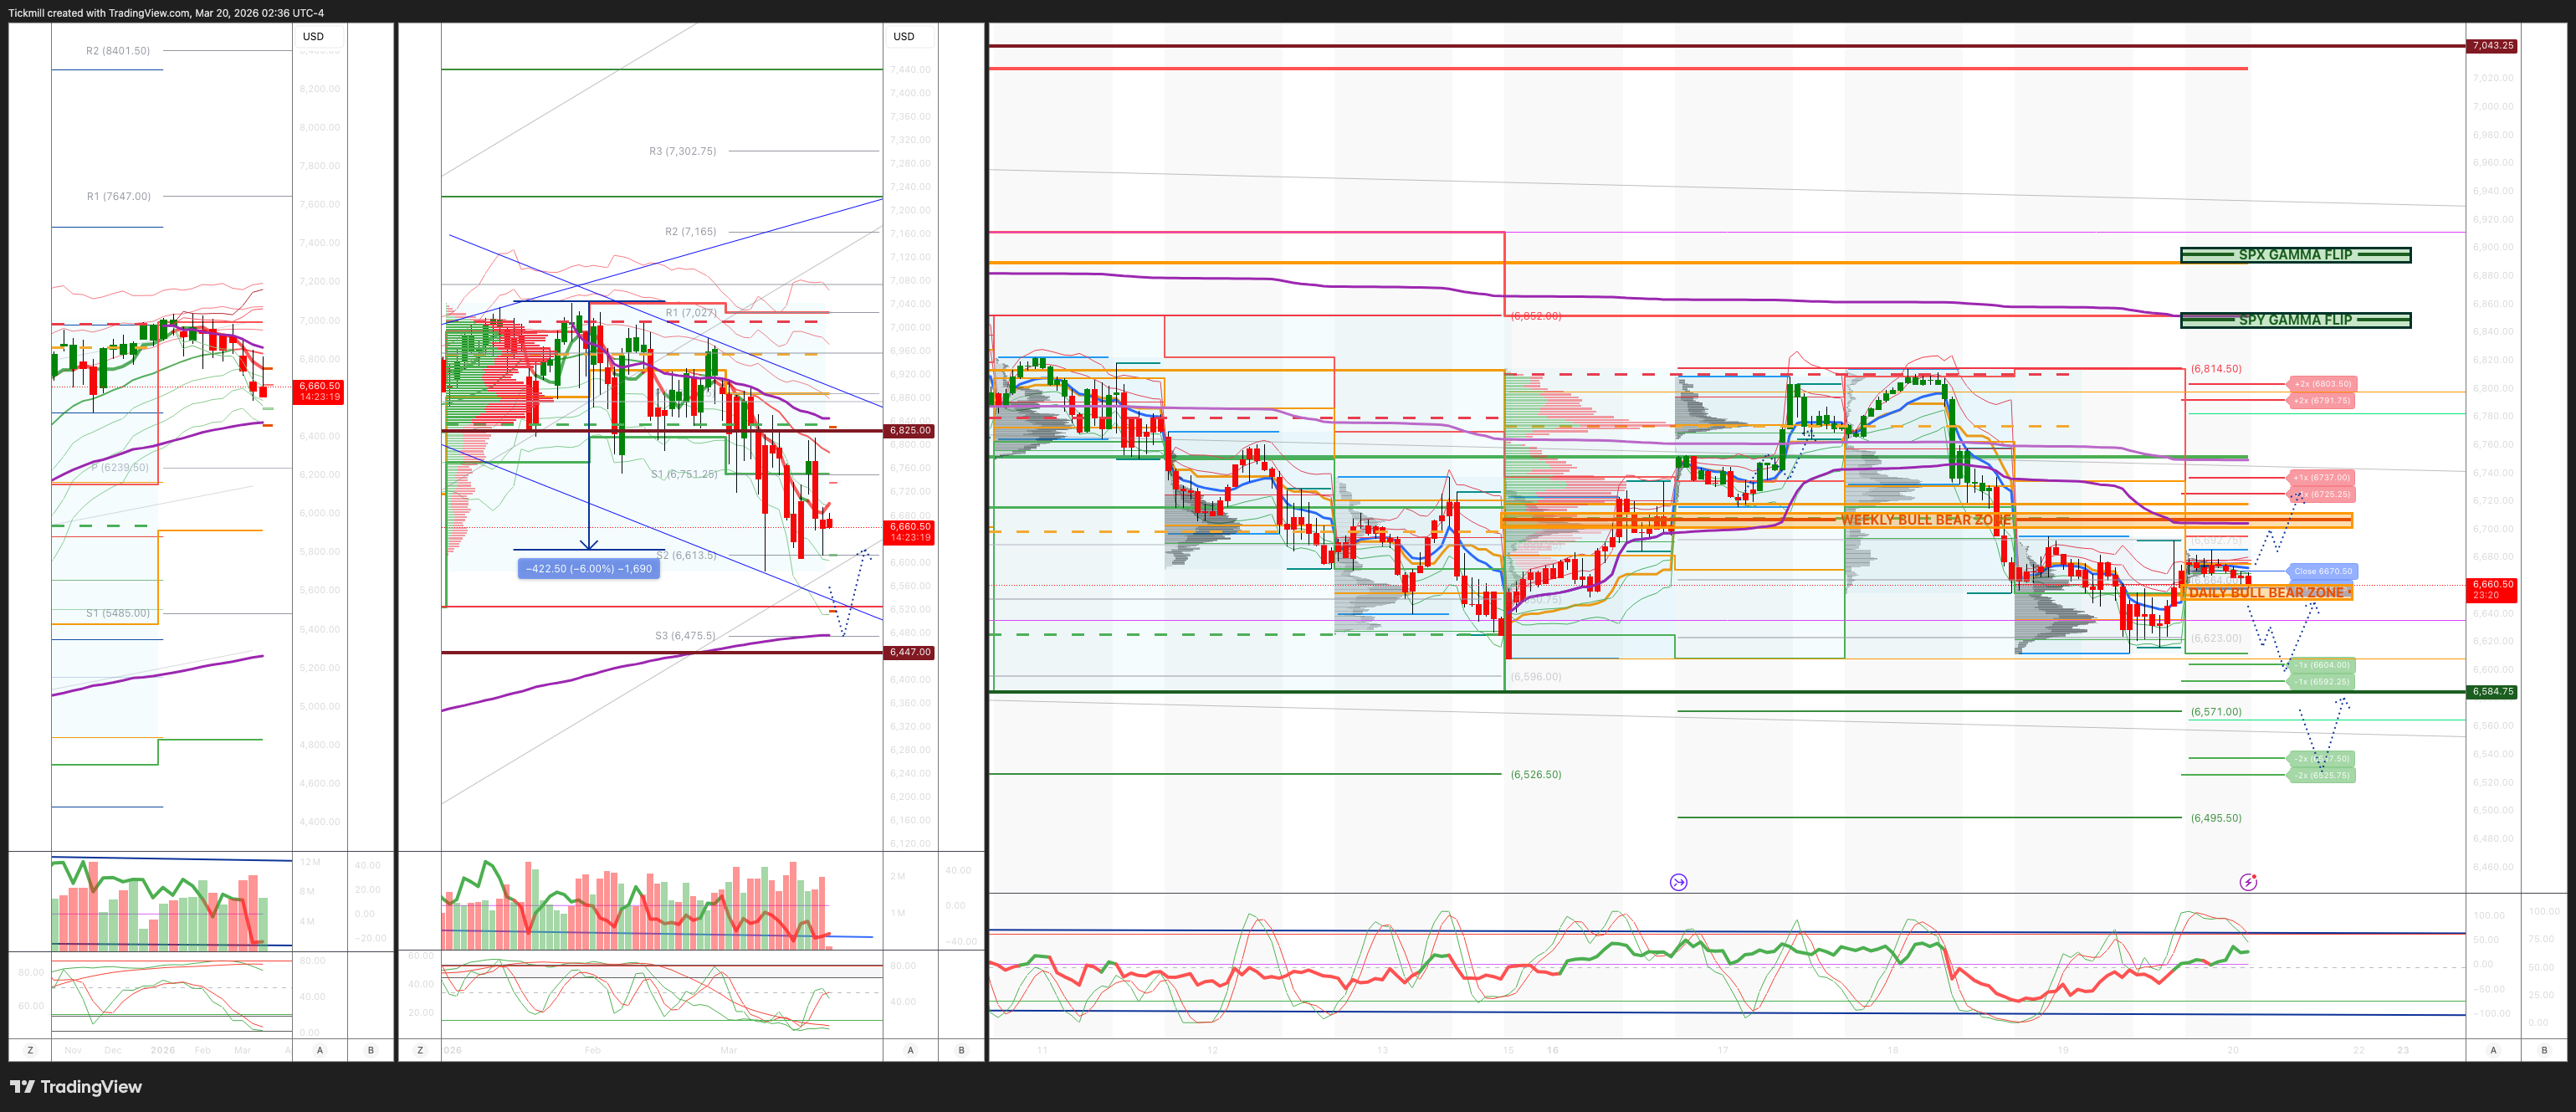
***QUOTING ES1! FOR CASH US500 EQUIVALENT LEVELS, SUBTRACT POINT DIFFERENCE***
WEEKLY BULL BEAR ZONE 6700/10
WEEKLY RANGE RES 6825 SUP 6426
Weekly Straddle Range: 199 -point straddle implies a weekly range of [6426, 6824]; monitor 1.5x and 2x moves for key reactions.
March OPEX Straddle: 232.8-point range suggests OPEX-to-OPEX movement between [6677, 7142].
March QOPEX Straddle: 368.55-point range projects [6466, 7203], based on December OPEX.
March EOM Straddle: 255.4-point straddle indicates a monthly range of [6623, 7101]. .
DEC2025 to DEC2026 OPEX straddle spans 945 points, outlining a range of [5889, 7779]."
DAILY VWAP BEARISH 6700
WEEKLY VWAP BEARISH 6777
MONTHLY VWAP BEARISH 6869
DAILY STRUCTURE – BALANCE - 6818/6627
WEEKLY STRUCTURE – OTFD - 6852
MONTHLY STRUCTURE - OTFD
Balance: This refers to a market condition where prices move within a defined range, reflecting uncertainty as participants await further market-generated information. Our approach to balance includes favouring fade trades at the range extremes (highs/lows) while preparing for potential breakout scenarios if the balance shifts.
One-Time Framing Higher (OTFH): This represents a market trend where each successive bar forms a higher low, signalling a strong and consistent upward movement.
One-Time Framing Lower (OTFD): This describ@es a market trend where each successive bar forms a lower high, indicating a pronounced and steady downward movement.
DAILY BULL BEAR ZONE 6660/50
GAMMA FLIP 6850 (SPY)
DAILY RANGE RES 6725 SUP 6592
2 SIGMA RES 6791 SUP 66525
VIX BULL BEAR ZONE 22
PUT/CALL RATIO 1.19 (The numbers reflect options traded during the current session. A put-call ratio below 0.7 is generally considered bullish, and a put-call ratio above 1.0 is generally considered bearish)
TRADES & TARGETS
LONG ON REJECT/RECLAIM DAILY BULL BEAR ZONE TARGET DAILY RANGE RES
(I FADE TESTS OF 2 SIGMA LEVELS ESPECIALLY INTO THE FINAL HOUR OF THE NY CASH SESSION AS 90% OF THE TIME WHEN TESTED THE MARKET WILL CLOSE ABOVE OR BELOW THESE LEVELS)
GOLDMAN SACHS TRADING DESK VIEW - ‘De-Gross’
S&P closed down 27bps at 6,606, with a Market-on-Close (MOC) imbalance of $200M to buy. The Nasdaq 100 (NDX) dropped 29bps to 24,355, while the Russell 2000 (R2K) gained 65bps to close at 2,495. The Dow Jones Industrial Average (Dow) declined 44bps to 46,021. Trading volume was robust, with 20 billion shares exchanged across all U.S. equity markets, surpassing the year-to-date daily average of 19.53 billion shares. The VIX fell 3.47% to 24.22. WTI crude oil dropped 141bps to $94.96, the U.S. 10-year Treasury yield slipped 1bps to 4.26%, gold plummeted 340bps to $4,654, the dollar index (DXY) declined 85bps to 99.23, and Bitcoin slid 140bps to $70,232.
The market reflected a broader risk-off sentiment and de-grossing activity across various asset classes, including oil, rates, metals, and cryptocurrencies, alongside a notable move in the 2s10s yield curve. A late-day rebound was attributed to geopolitical developments involving Israel. A significant market dynamic was observed as long-only (LO) funds net sold $9.6 billion, marking the largest single-day net selling event since 2022—a 5-sigma event. This surpassed the previous record of $8.7 billion on July 31, 2025. Selling was broad-based across all sectors, with the heaviest sell skews in Technology, Media, and Telecommunications (TMT), Consumer, and Industrials. Hedge funds (HFs), in contrast, were modest net buyers at $750 million, driven by scattered cover demand in macro products, alternatives, and healthcare. Overall activity on the trading floor was rated a 7 out of 10, with the floor finishing -15% for sale versus a 30-day average of +30bps.
On the economic data front, weekly jobless claims and the Philly Fed Manufacturing Index pointed to a cooling labor market but highlighted persistent input price pressures, complicating the Federal Reserve's dual mandate. On the corporate side, Micron Technology (MU) dropped 4% despite exceeding high expectations, as the market perceived a fundamental top in its performance. Conversely, Accenture (ACN) gained 4% following a solid earnings report that aligned with expectations. Central banks remained in focus, with the Bank of England (BOE) adopting a hawkish tone. Notably, the UK two-year yield rose 27bps after the BOE flagged inflation risks. BOE member Catherine Mann emphasized a shift from rate cuts to a longer hold or potential hikes to counter persistent inflation, echoing the Federal Reserve’s hawkish stance from the prior day.
Commodities saw sharp declines, particularly in industrial metals such as copper, gold, silver, and aluminum. Copper erased its year-to-date gains as escalating tensions in the Middle East drove energy prices higher and raised demand concerns. The situation was exacerbated by strikes on energy facilities exchanged between Iran and Israel. Meanwhile, stockpiles of aluminum and copper surged in China. Interestingly, precious metals failed to act as traditional inflation hedges despite hotter inflation data and rising energy prices.
In derivatives, the market trended lower for most of the day, with little panic observed on volatility desks. Despite trading below the 200-day moving average and crude oil remaining bid, both volatility and skew softened. Following late-breaking headlines, there was notable buying of next-week SPY calls, marking the first significant upside activity in some time. Dealers remain short gamma and could face increased exposure with further downside moves. A 1.5% decline would push dealers short by approximately $5 billion, suggesting quarter-end dynamics may outweigh the impact of Friday's expiry. With equities yet to fully price in additional fear, short delta structures and SPX or NDX put spreads are preferred. The straddle for the remainder of the week closed at approximately 1%..
Disclaimer: The material provided is for information purposes only and should not be considered as investment advice. The views, information, or opinions expressed in the text belong solely to the author, and not to the author’s employer, organization, committee or other group or individual or company.
Past performance is not indicative of future results.
High Risk Warning: CFDs are complex instruments and come with a high risk of losing money rapidly due to leverage. 69% and 73% of retail investor accounts lose money when trading CFDs with Tickmill UK Ltd and Tickmill Europe Ltd respectively. You should consider whether you understand how CFDs work and whether you can afford to take the high risk of losing your money.
Futures and Options: Trading futures and options on margin carries a high degree of risk and may result in losses exceeding your initial investment. These products are not suitable for all investors. Ensure you fully understand the risks and take appropriate care to manage your risk.
Patrick has been involved in the financial markets for well over a decade as a self-educated professional trader and money manager. Flitting between the roles of market commentator, analyst and mentor, Patrick has improved the technical skills and psychological stance of literally hundreds of traders – coaching them to become savvy market operators!