S&P500 Daily Action Areas & Price Targets 21/9/26

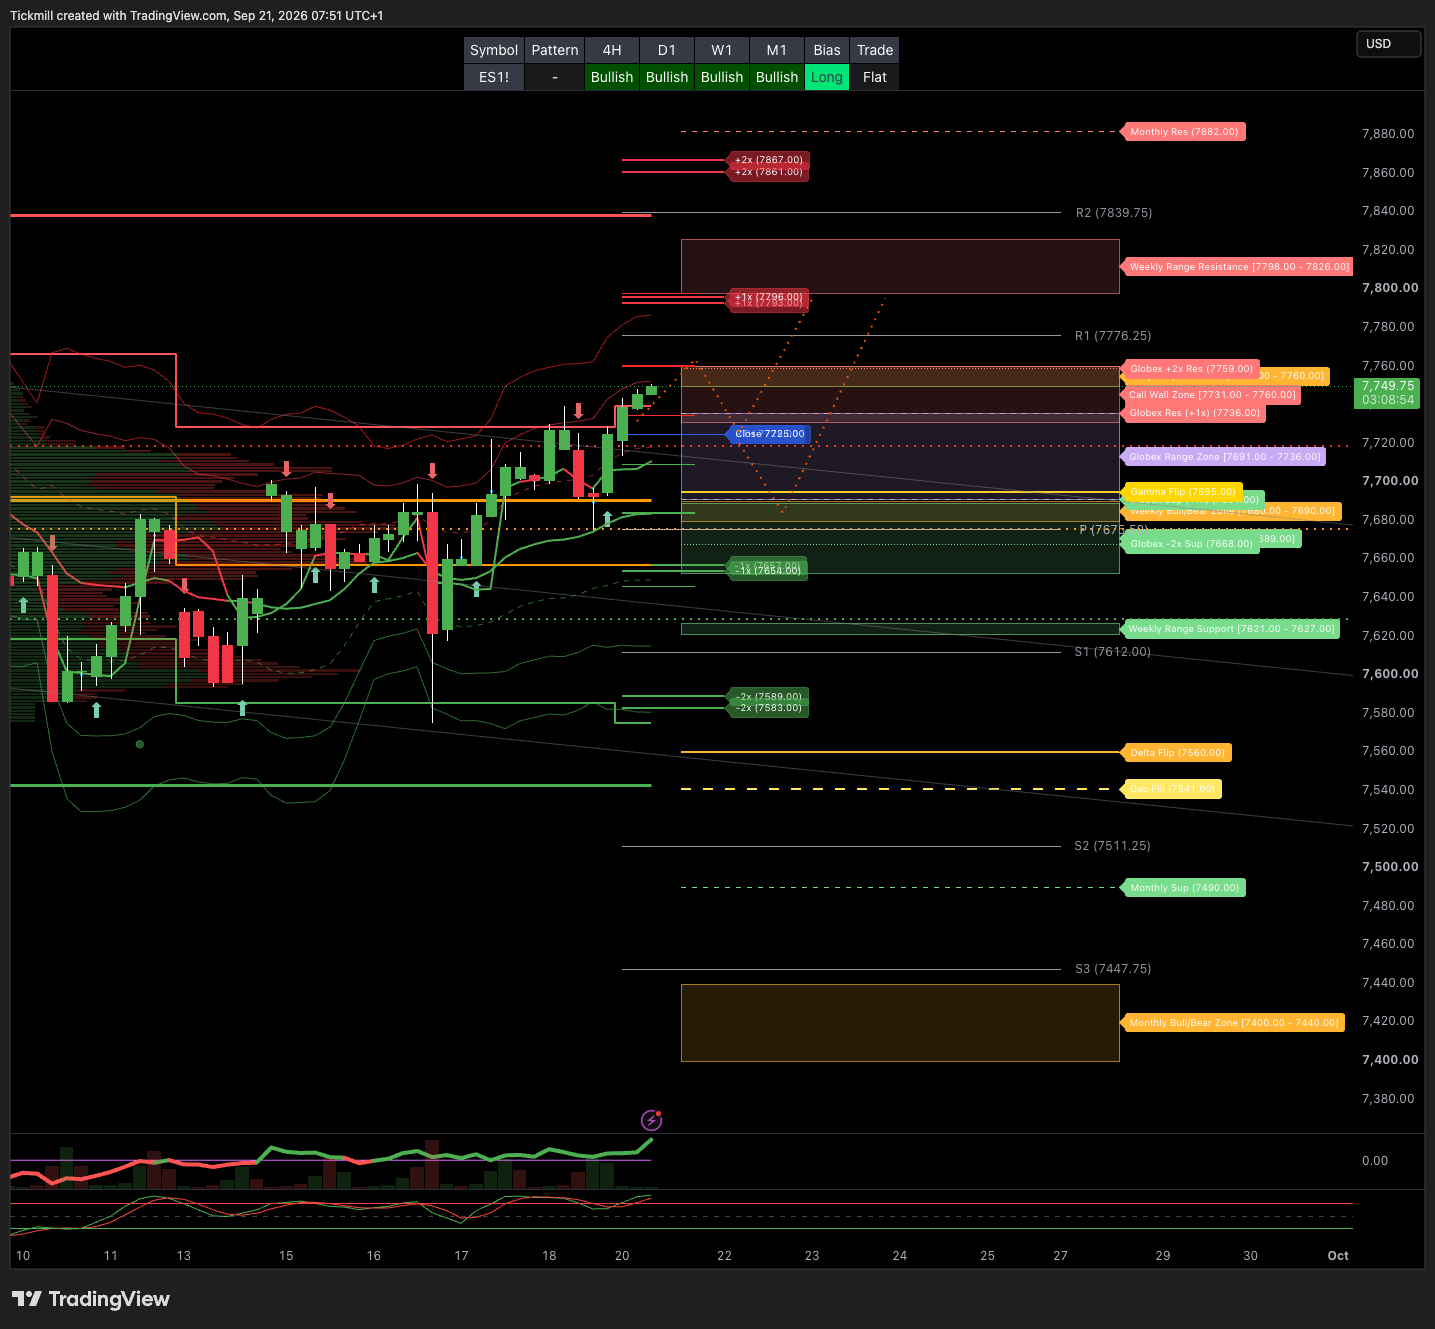
S&P500 Daily Action Areas & Price Targets 21/9/26
***QUOTING ES1!(Z CONTRACT LEVLES) FOR CASH US500 EQUIVALENT LEVELS, SUBTRACT POINT DIFFERENCE***
MONTHLY-WEEKLY& DAILY LEVELS
MONTHLY BULL BEAR ZONE 7440/7400
MONTHLY RANGE RES 7882 SUP 7490
WEEKLY BULL BEAR ZONE 7690/80
WEEKLY RANGE RES 7826/7798 SUP 7621/27
DAILY BULL BEAR ZONE 7750/60
GLOBEX RANGE SUP 7691 RES 7736
2 SIGMA RANGE SUP 7668 RES 7759
GAMMA FLIP 7695
DELTA FLIP 7560
PUT WALLS 7689/7653
CALL WALLS 7760 / 7731
UNFILLED GAPS 7541
DAILY STRUCTURE - BALANCE - 7719/7557
WEEKLY STRUCTURE - OTFL - 7717
MONTHLY STRUCTURE - OTFH - 7542
VIX BULL BEAR ZONE 17.7
VVIX / VIX ratio around 5.68 sits comfortably within typical historical norms (median ranges usually hover near 5.0 to 6.0).
PRIMARY TRADES & TARGETS
LONG ON REJECT/RECLAIM DBBZ TARGET DAILY RANGE RES
***ADDITIONAL SETUPS & TARGETS HIGHLIGHTED ON THE CHARTS***
(I FADE TESTS OF 2 SIGMA LEVELS ESPECIALLY INTO THE FINAL HOUR OF THE NY CASH SESSION AS 90% OF THE TIME WHEN TESTED THE MARKET WILL CLOSE ABOVE OR BELOW THESE LEVELS)
SPX PUT/CALL RATIO 1.13 (The numbers reflect options traded during the current session.) A put-call ratio below 0.7 is generally considered bullish, and a put-call ratio above 1.0 is generally considered bearish.
JHEQX Q3 Collar Short Call Cap: ~7,750 – 7,900 - Long Put Strike: ~7,050 – 7,100 (approx. 5% downside protection) Short Put Strike: ~5,950
DEC2025 OPEX to DEC2026 OPEX is 945 points giving us a range of [5889,7779]
Notes On Structure Implications
Balance: This refers to a market condition where prices move within a defined range, reflecting uncertainty as participants await further market-generated information. Our approach to balance includes favouring fade trades at the range extremes (highs/lows) while preparing for potential breakout scenarios if the balance shifts.
One-Time Framing Higher (OTFH): This represents a market trend where each successive bar forms a higher low, signalling a strong and consistent upward movement.
One-Time Framing Lower (OTFL): This describes a market trend where each successive bar forms a lower high, indicating a pronounced and steady downward movement.
GOLDMAN SACHS FICC & EQUITY TRADING DESK VIEW
GLOBAL FLOWS, CHINA'S EXPORT EXPANSION & INDIA'S AI ENABLERS
Author: Benny Quek (Goldman Sachs Managing Director, Global Banking & Markets)
Date: September 19, 2026
THE TAKE: GLOBAL FLOW ROTATION, CHINA'S EXPANSION & INDIA'S AI BACKSTAGE
Global equity markets are navigating a structural interplay between central bank tightening, factor rotations, and regional capital realignments. Over the past week, institutional flows saw Developed Markets (DM) buying funded by Asia selling, with US equities recording their largest net buying in 5 weeks (led by Tech recovery and Mag-7 inflows). European equities saw their fastest net buying pace in 5 months, driven primarily by short-covering across Industrials, Tech, and Discretionary—though net allocations remain near 5-year troughs.
Concurrently, two structural themes are reshaping global portfolios:
China's "Go Global" Theme: Chinese exports are shifting from low-value B2C/EM market share gains toward high-tech "Latecomer" categories (Robotaxis, surgical robotics, e-commerce, transformers), exporting deflation and quality globally.
India's AI Enabler Ecosystem: Beyond the benchmark "anti-AI" narrative, a curated basket of 42 Indian SMID-cap AI enablers has surged +60% YTD (vs. NIFTY -11%), anchoring ~40% of NIFTY 500's total capex growth this year.
GLOBAL FLOWS & POSITIONING MATRIX
US Equity & Tech Flows: Strong net buying over the past month. Net allocations to Mag-7 have returned to near-peak levels. Software remains on a recovery path as the single most net-bought sub-sector over the past month.
European Equities: Net bought at the fastest pace in 5 months, primarily short-covering across Industrials, Tech, and Discretionary. Net exposure remains at historical trough levels.
Asia Local Flows: Continued rotation within Asia from Korea/Taiwan/Japan into Hong Kong/China. Active Asia ex-Japan (AEJ) Long-Only funds saw the largest positioning increases in China and India through August.
Earnings vs. Bubble Debate (Peter Oppenheimer & GS House View): S&P 500 EPS grew +50% YoY in 2Q (+26% on a 4-quarter trailing basis). While reflecting "over-earning," fundamentals do not indicate an earnings bubble. GS base case projects +11% SPX EPS growth in 2027 ($415) and 2028 ($460), supported by solid macro conditions against fading AI tailwinds.
CHINA'S "GO GLOBAL" STRUCTURAL MARGIN & ROE IMPLICATIONS
A comprehensive multi-sector study stitching together insights from 36 GS global analysts across 11 sectors and 40 global companies highlights a fundamental shift in China's export machine:
Historical Track Record: The largest market share gains occurred in Emerging Markets (not the US) and B2C consumer products (rather than industrial capital goods). Although Chinese exports typically enter at an average 30% price discount, prices subsequently increased in 7 of 11 sectors post-entry.
The 2035 Horizon: Aggregate ex-China market share is projected to jump from 18% to 31% by 2035. Upside remains largely unpriced in "Latecomer" sectors: Robotaxis, surgical robots, e-commerce, clear aligners, and electrical transformers.
Macro & ROE Threat for DM Peers: As China exports both deflation and high quality, structural margins, return on equity (ROE), and baseline P/E multiples for Developed Market competitors face long-term multiple compression risks.
INDIA'S "ANTI-AI" CONTRARIAN PLAYBOOK: THE 42 ENABLERS
While benchmark headlines portray India as an "anti-AI" laggard (NIFTY -11% YTD), a Granular Screen reveals a high-performing 42-stock "AI Enabler" cohort driving domestic infrastructure:
Performance & Capex Momentum: The 42-stock basket is +60% YTD. Crucially, these 42 names account for ~40% of NIFTY 500's entire capex growth in 2026, driving a broader domestic industrial expansion.
Sub-Sector Coverage: Spans power generation/equipment (Adani Green, Tata Power, Power Grid, Siemens India, Cummins), datacenter hardware/operations, semiconductor OSATs/materials, and specialized electrical cables (Polycab India).
Flows & Valuation Angle: Foreign Institutional Investor (FII) net flows quietly turned positive through 2Q, July, and August. Valuation pushback is mitigated by the fact that earnings growth is outpacing multiple expansion across the enabler basket.
Disclaimer: The material provided is for information purposes only and should not be considered as investment advice. The views, information, or opinions expressed in the text belong solely to the author, and not to the author’s employer, organization, committee or other group or individual or company.
Past performance is not indicative of future results.
High Risk Warning: CFDs are complex instruments and come with a high risk of losing money rapidly due to leverage. 69% and 73% of retail investor accounts lose money when trading CFDs with Tickmill UK Ltd and Tickmill Europe Ltd respectively. You should consider whether you understand how CFDs work and whether you can afford to take the high risk of losing your money.
Futures and Options: Trading futures and options on margin carries a high degree of risk and may result in losses exceeding your initial investment. These products are not suitable for all investors. Ensure you fully understand the risks and take appropriate care to manage your risk.
Patrick has been involved in the financial markets for well over a decade as a self-educated professional trader and money manager. Flitting between the roles of market commentator, analyst and mentor, Patrick has improved the technical skills and psychological stance of literally hundreds of traders – coaching them to become savvy market operators!